Home / Layout
Layout.
Martin’s TradingView chart: four EMAs, ADR, low-of-day distance, market cap, and dollar volume.
Chart reference.
Four EMAs sit on the price chart, with ADR and LoD distance in a small table. The lower histogram shows dollar volume, not share volume.
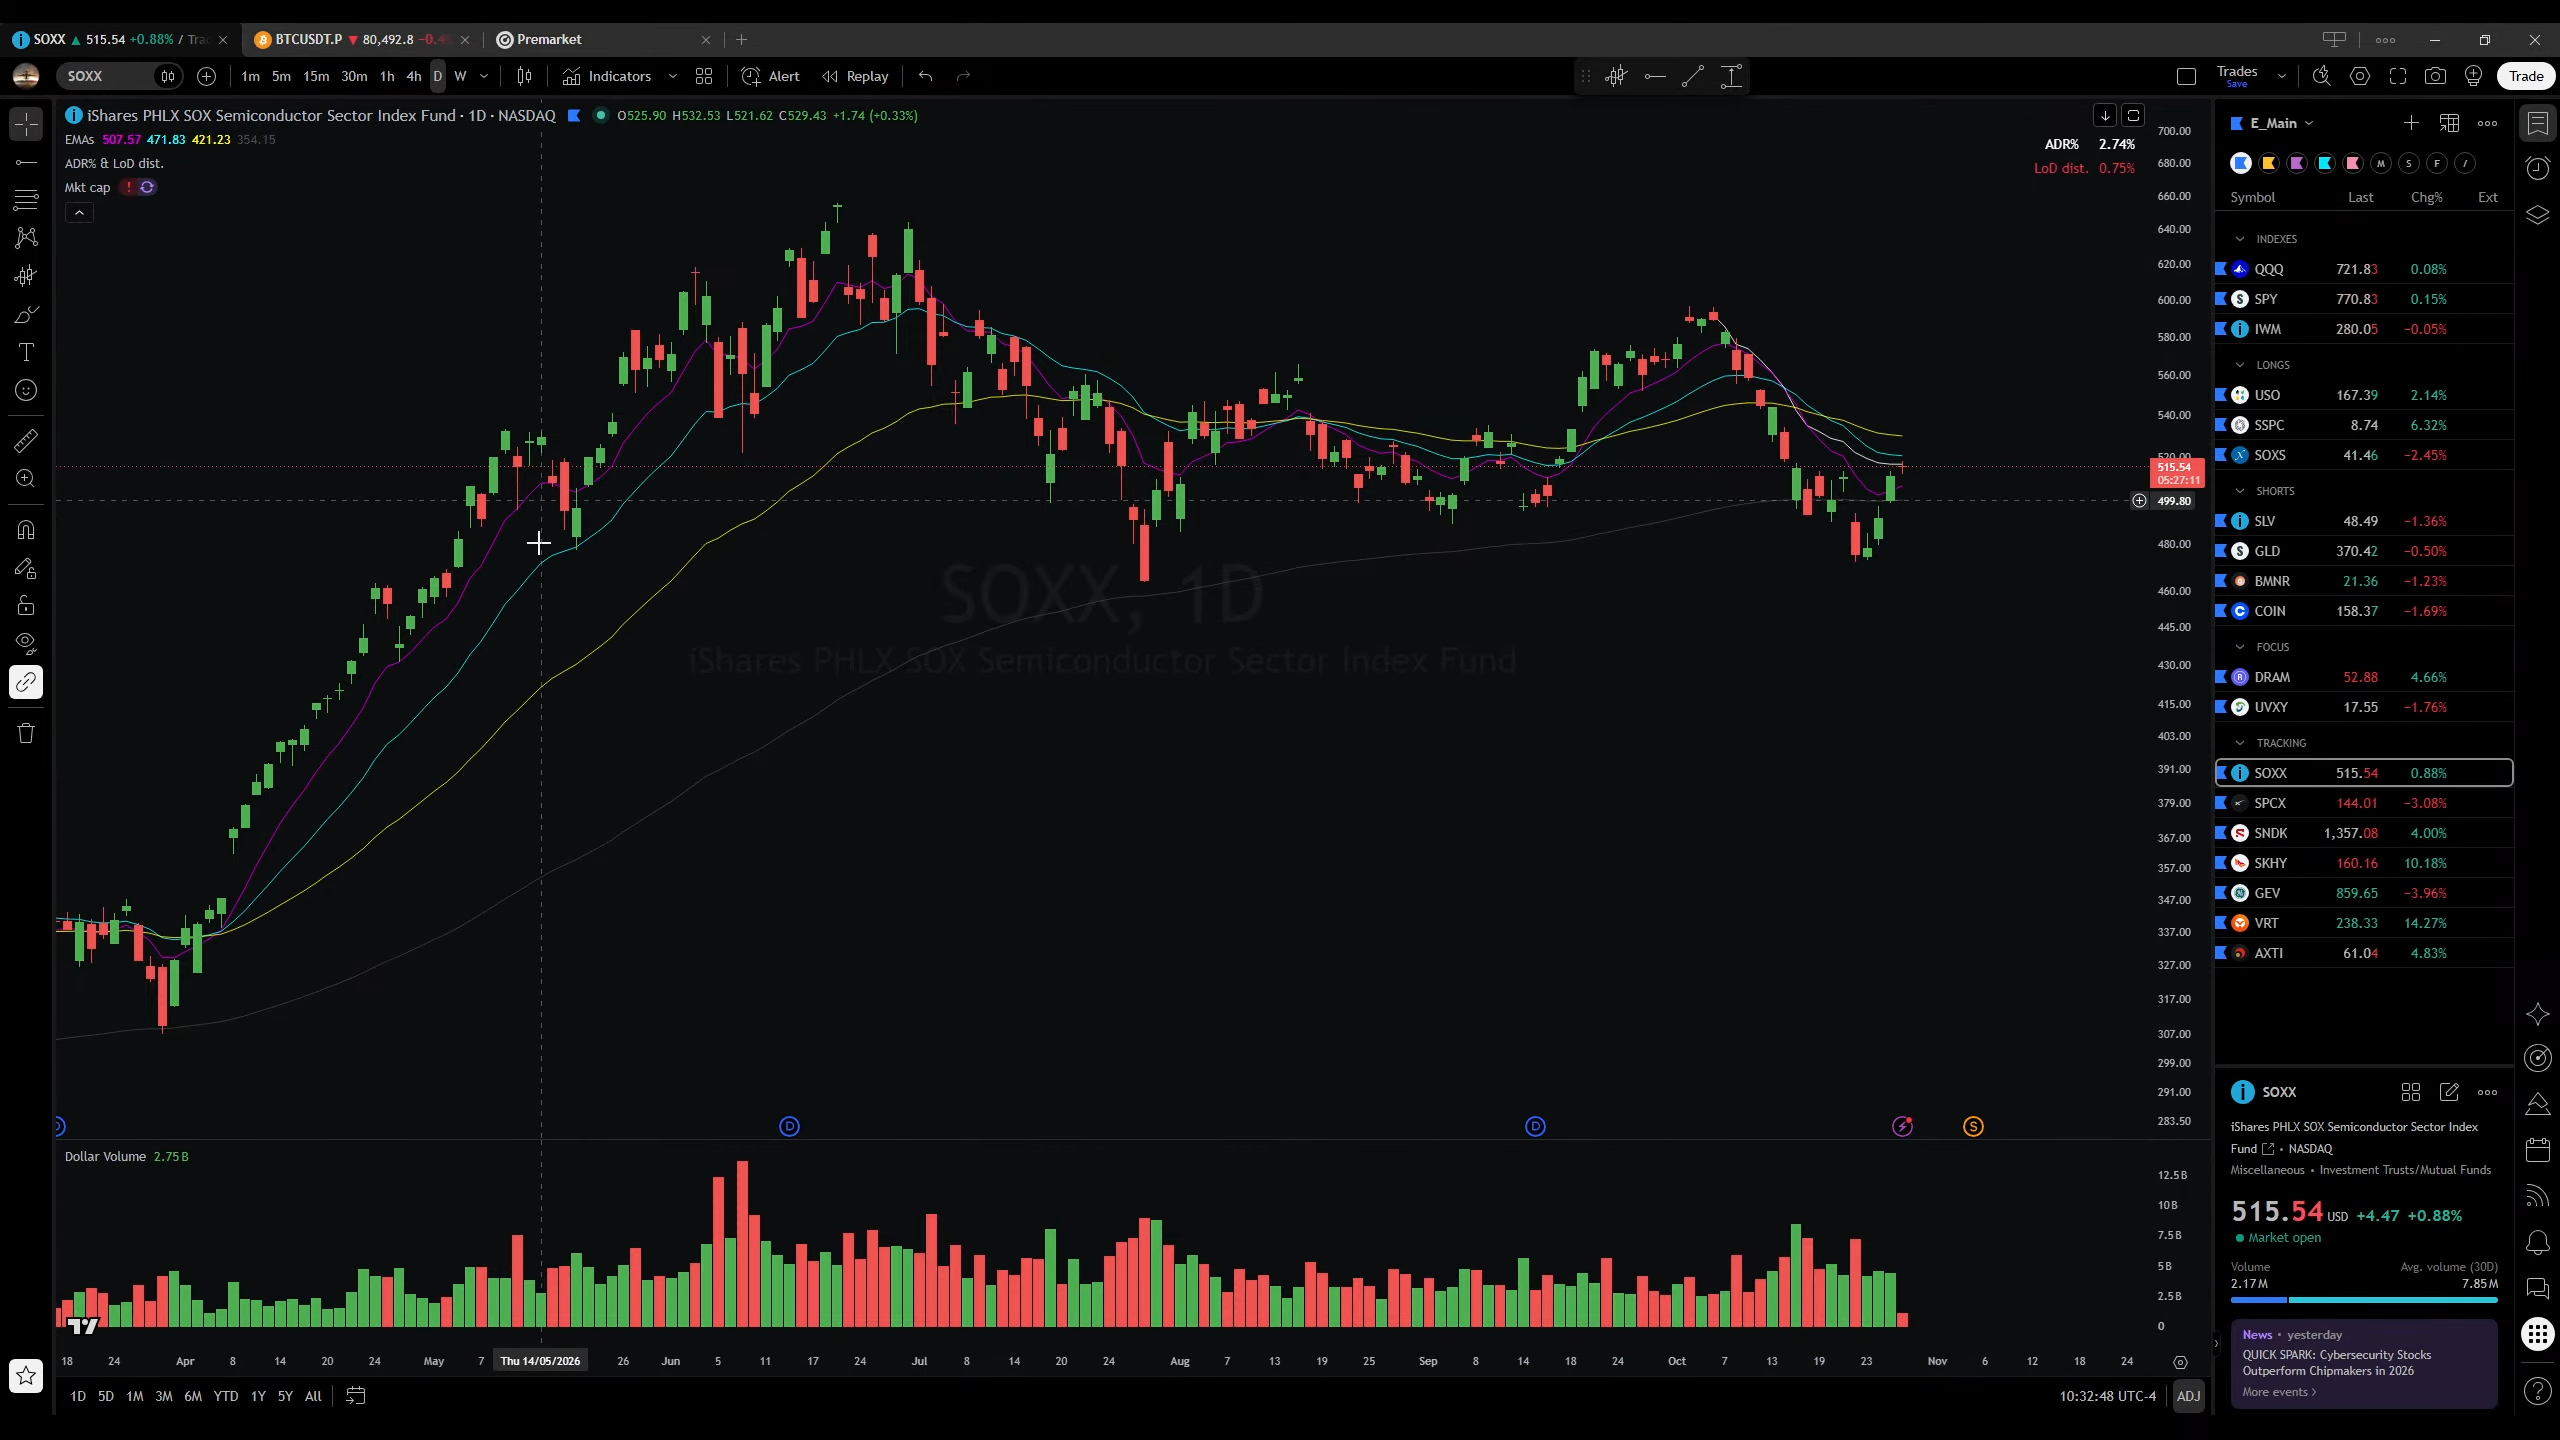
Indicators & settings.
| Indicator | Setup |
|---|---|
| EMAs | 9, 21, 50, and 150 periods on the price chart. |
| ADR & LoD distance | Average daily range (%) and distance from the day’s low (%) in a compact table. ADR% / ATR / LoD dist. Table ↗ArmerSchlucker · example script |
| Market cap | A market-cap indicator on the price chart. The capture does not identify a public script. |
| Dollar volume | A histogram in the bottom pane, replacing ordinary share volume. Dollar Volume ↗Traders-Agency · example script |
The linked scripts are examples, not confirmed as Martin’s exact versions. The capture does not show the ADR lookback or other indicator inputs.
Set up in TradingView.
Add the indicators with the settings above. For the lower pane, remove ordinary Volume and add Dollar Volume. Compare your chart with the full-size screenshot.
Use this guide to build your own layout; a shared TradingView layout link is not available.